
| It is now coming up to four years since our last major acquisition (of NCS in September 2000), and more than two years since our last major disposal (of our 22% stake in RTL in January 2002). Our portfolio is now relatively stable and, as a result, our accounts are much simpler than they were during our transformation. Our acquisitions during the year were relatively small, and we absorbed all costs of integrating new businesses and restructuring existing ones within our operating profit. Our internet businesses are fully integrated with their print counterparts, so their financial results are no longer reported separately. In 2003 we are showing a statutory profit for the financial year of £55m, following losses in 2002 and 2001 and helped by a lower goodwill charge. |
||||||||||||||||||||||||||||||||||||||||||||||||||||||||||||||||||||||||||||||||||||||||||||||||||||||||||||||||||||||||||||||||||||||||||||||||||||||||||||
Financial statements |
||||||||||||||||||||||||||||||||||||||||||||||||||||||||||||||||||||||||||||||||||||||||||||||||||||||||||||||||||||||||||||||||||||||||||||||||||||||||||||
| Goodwill amortisation Goodwill is a balance sheet item which represents the difference between the price paid for acquisitions and the fair value of the assets acquired. Pearson amortises goodwill to the profit and loss account over whichever is the shorter of the estimated useful life of the acquisition and a period of 20 years. The goodwill amortisation charge fell by £66m last year to £264m, mainly due to Family Education Network and CBS Marketwatch, where the final amortisation charges were incurred in the first half of 2003. This goodwill charge is a non-cash item which would not be incurred under US GAAP. Goodwill impairment Goodwill is subject to an impairment review at the end of the first full year following an acquisition and at any other time if events or changes in circumstances indicate that the carrying value may not be recoverable. In 2003 no impairment charges were necessary. The charge in 2002 of £10m related to a subsidiary of Recoletos in Argentina. Integration costs Integration costs are the one-off costs of integrating significant recent acquisitions into our existing businesses. The last of these significant acquisitions occurred in 2000 and the final costs of integration were incurred in 2002. In 2003 there were no integration charges and all other restructuring and related costs have been expensed through the profit and loss account as part of the ongoing operations of our businesses. The integration charges in 2002 were £7m related to the integration of NCS into Pearson Education and £3m incurred in integrating Dorling Kindersley into the Penguin Group. Non operating items Non operating items relate to gains and losses on the sale or closure of businesses and on the sale of fixed assets. In 2003 we had an overall profit on non operating items of £6m, mainly relating to the sale of an associate investment in Unidesa by Recoletos. The principal items in 2002 were a profit of £18m relating to the completion of the sale of RTL and losses of £40m and £8m on the sale of the Forum business and PH Direct respectively. Interest Net operating interest fell by £14m to £80m, with average net debt decreasing by £157m. Interest was further reduced by the effect of a general fall in interest rates during the year. The weighted average three month LIBOR rate, reflecting the Group's borrowings in US dollars, euros, and sterling, fell by 75 basis points, or 0.75%. The impact of these falls was dampened by our treasury policy of having 40-65% of net debt at fixed interest rates. As a result, the Group's net interest rate payable averaged approximately 4.6%, improving from 5% in the previous year. During 2002 we took a one-off charge of £37m for cancellation of certain swap contracts and the early repayment of debt following re-balancing of the Group's debt portfolio on the receipt of proceeds from the RTL disposal at the start of that year. Taxation The tax charge for the year was £75m. As in previous years, this high rate of tax has come about mainly because there is only very limited tax relief available for goodwill amortisation charged in the accounts. The total tax charge of £75m includes credits of £56m relating to prior year items; these reflect a combination of settlements with Revenue authorities and changes to deferred tax balances. The tax rate on adjusted earnings fell from 32.8% in 2002 to 31.2% in 2003. This decline reflects the factors above, the impact of the dollar exchange rate, and a more favourable mix of profits between higher and lower tax rate jurisdictions. Minority interests Minority interests include a 39% minority share in IDC and a 21% minority share in Recoletos. |
||||||||||||||||||||||||||||||||||||||||||||||||||||||||||||||||||||||||||||||||||||||||||||||||||||||||||||||||||||||||||||||||||||||||||||||||||||||||||||
 |
||||||||||||||||||||||||||||||||||||||||||||||||||||||||||||||||||||||||||||||||||||||||||||||||||||||||||||||||||||||||||||||||||||||||||||||||||||||||||||
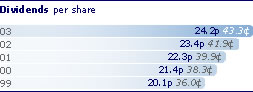
Dividends The dividend payment of £192m which we are recommending in respect of 2003 represents 24.2p per share – a 3.4% increase on 2002. The dividend is covered 1.3 times by adjusted earnings and 1.1 times by operating free cash flow. We seek to maintain a balance between the requirements of our shareholders, including our many private shareholders, for a rising stream of dividend income and the reinvestment opportunities that we see across Pearson. This balance has been expressed in recent years as a commitment to increase our annual dividend faster than the prevailing rate of inflation while progressively reinvesting a higher proportion of our distributable earnings in our business. |
||||||||||||||||||||||||||||||||||||||||||||||||||||||||||||||||||||||||||||||||||||||||||||||||||||||||||||||||||||||||||||||||||||||||||||||||||||||||||||
Other financial items |
||||||||||||||||||||||||||||||||||||||||||||||||||||||||||||||||||||||||||||||||||||||||||||||||||||||||||||||||||||||||||||||||||||||||||||||||||||||||||||
| Pensions Pearson operates a variety of pension schemes. Our UK fund is by far the largest and we also have some smaller defined benefit funds in the US and Canada. Outside the UK, most of our people operate 401K (essentially defined contribution) plans. Our most recent full valuation of the UK Pension Fund was in 2001 and the next full valuation will be completed during 2004. The pension funding level is kept under regular review by the company and the Fund trustees. After an informal indication in late 2002, and taking account of current stock market conditions at that time, the company increased contributions by £5m to £25m for 2003. The company also took an additional £6m charge to the profit and loss account.
This additional contribution was designed to keep the scheme fully funded and to establish a contributing level (£25m) which is in line with expectations for the 2004 full valuation. In this report we have again included additional disclosure in respect of FRS 17 'Retirement benefits' for pensions and other post retirement benefits. FRS 17 approaches pension cost accounting from a balance sheet perspective with the net surplus or deficit in Pearson's pension schemes being incorporated into the balance sheet. Changes in this surplus or deficit will flow through the profit and loss account and the statement of total recognised gains and losses. In this report we have disclosed the effect on the profit and loss account and balance sheet in the notes to the accounts. Accounting disclosures and policies As described above we have again included additional disclosure in accordance with the transitional arrangements of FRS 17. In 2003 we have |
||||||||||||||||||||||||||||||||||||||||||||||||||||||||||||||||||||||||||||||||||||||||||||||||||||||||||||||||||||||||||||||||||||||||||||||||||||||||||||
Managing our financial risks |
||||||||||||||||||||||||||||||||||||||||||||||||||||||||||||||||||||||||||||||||||||||||||||||||||||||||||||||||||||||||||||||||||||||||||||||||||||||||||||
| This section explains the Group's approach to the management of financial risk. Treasury policy The Group holds financial instruments for two principal purposes: to finance its operations and to manage the interest rate and currency risks arising from its operations and its sources of finance. The Group finances its operations by a mixture of cash flows from operations, short-term borrowings from banks and commercial paper markets, and longer term loans from banks and capital markets. The Group borrows principally in US dollars, euros and sterling, at both floating and fixed rates of interest, using derivatives, where appropriate, to generate the desired effective currency profile and interest rate basis. The derivatives used for this purpose are principally interest rate swaps, interest rate caps and collars, currency swaps and forward foreign exchange contracts. The main risks arising from the Group's financial instruments are interest rate risk, liquidity and refinancing risk, counterparty risk and foreign currency risk. These risks are managed by the chief financial officer under policies approved by the board which are summarised below. These policies have remained unchanged, except as disclosed, since the beginning of 2003. A treasury committee of the board receives reports on the Group's treasury activities, policies and procedures, which are reviewed periodically by a group of external professional advisers. The treasury department is not a profit centre and its activities are subject to internal audit. |
||||||||||||||||||||||||||||||||||||||||||||||||||||||||||||||||||||||||||||||||||||||||||||||||||||||||||||||||||||||||||||||||||||||||||||||||||||||||||||
| Interest rate risk The Group's exposure to interest rate fluctuations on its borrowings is managed by borrowing on a fixed rate basis and by entering into interest rate swaps, interest rate caps and forward rate agreements. Since October 2002 the Group's policy objective
has been to set a target proportion of its forecast borrowings (taken at the year end, with
cash netted against floating rate debt) to be hedged (i.e. fixed or capped) over the next four years within a 40% to 65% range. At the end of 2003 that ratio was 61%. A 1% change in the Group's variable rate US dollar, euro and sterling interest rates would have a £5m effect on profit before tax. Liquidity and refinancing risk The Group's objective is to procure continuity of funding at a reasonable cost. To do this it seeks to arrange committed funding for a variety of maturities from a diversity of sources. The Group's policy objective has been that the weighted average maturity of its core gross borrowings (treating short-term advances as having the final maturity of the facilities available to refinance them) should be between three and 10 years. At the end of 2003 the average maturity of gross borrowings was 4.9 years and non-banks provided £1,718m (89%) of them (up from 4.8 years and down from 90% respectively at the beginning of the year). The Group believes that ready access to different funding markets also helps to reduce its liquidity risk, and that published credit ratings and published financial policies improve such access. The Group manages the amount of its net debt, and the level of its net interest cover, principally by the use of a target range for its interest cover ratio. All of the Group's credit ratings remained unchanged during the year. The long-term ratings are Baa1 from Moody's and BBB+ from Standard & Poor's, and the short-term ratings are P2 and A2 respectively. The Group continues to operate on the basis that the board will take such action as it believes necessary to support and protect its current credit ratings. The Group also maintains undrawn committed borrowing facilities. At the end of 2003 these amounted to £950m and their weighted average maturity was 1.5 years. |
||||||||||||||||||||||||||||||||||||||||||||||||||||||||||||||||||||||||||||||||||||||||||||||||||||||||||||||||||||||||||||||||||||||||||||||||||||||||||||
| Counterparty risk The Group's risk of loss on deposits or derivative contracts with individual banks is managed in part through the use of counterparty limits. These limits, which take published credit limits (among other things) into account, are approved by the chief financial officer. In addition, for certain longer-dated, higher-value derivative contracts, specifically, a currency swap that transforms a major part of the 6.125% eurobonds due 2007 into a US dollar liability, the Group has entered into mark-to-market agreements whose effect is to reduce significantly the counterparty risk of the relevant transactions. Currency risk Although the Group is based in the UK, it has its most significant investment in overseas operations. The most significant currency for the Group is the US dollar, followed by the euro and sterling. The Group's policy on routine transactional conversions between currencies (for example, the collection of receivables, and the settlement of payables or interest) remains that these should be effected at the relevant spot exchange rate. No unremitted profits are hedged with foreign exchange contracts as the company judges it inappropriate to hedge non-cash flow translational exposure with cash flow instruments. However, the Group does seek to create a 'natural hedge' though its policy of aligning approximately the currency composition of its core borrowings in US dollars, euros and sterling with the split between those currencies of its forecast operating profit. This policy aims to dampen the impact of changes in foreign exchange rates on consolidated interest cover and earnings. Long-term core borrowing is limited to these three major currencies. However, the Group still borrows small amounts in other currencies, typically for seasonal working capital needs. At the year end the split of aggregate net borrowings in its three core currencies was US dollar 81%, euro 10% and sterling 9%. |
||||||||||||||||||||||||||||||||||||||||||||||||||||||||||||||||||||||||||||||||||||||||||||||||||||||||||||||||||||||||||||||||||||||||||||||||||||||||||||
|
||||||||||||||||||||||||||||||||||||||||||||||||||||||||||||||||||||||||||||||||||||||||||||||||||||||||||||||||||||||||||||||||||||||||||||||||||||||||||||
|
||||||||||||||||||||||||||||||||||||||||||||||||||||||||||||||||||||||||||||||||||||||||||||||||||||||||||||||||||||||||||||||||||||||||||||||||||||||||||||
|
||||||||||||||||||||||||||||||||||||||||||||||||||||||||||||||||||||||||||||||||||||||||||||||||||||||||||||||||||||||||||||||||||||||||||||||||||||||||||||
|
||||||||||||||||||||||||||||||||||||||||||||||||||||||||||||||||||||||||||||||||||||||||||||||||||||||||||||||||||||||||||||||||||||||||||||||||||||||||||||
|
||||||||||||||||||||||||||||||||||||||||||||||||||||||||||||||||||||||||||||||||||||||||||||||||||||||||||||||||||||||||||||||||||||||||||||||||||||||||||||
|
||||||||||||||||||||||||||||||||||||||||||||||||||||||||||||||||||||||||||||||||||||||||||||||||||||||||||||||||||||||||||||||||||||||||||||||||||||||||||||
|
||||||||||||||||||||||||||||||||||||||||||||||||||||||||||||||||||||||||||||||||||||||||||||||||||||||||||||||||||||||||||||||||||||||||||||||||||||||||||||