

 |
||||||||||||||||||||||||||||||||||||||||||||||||||||||||||||||||||||
| Since 1997 we’ve been working on building Pearson in an environment in which knowledge is power and we provide some of the fuel. The last few years have been hard on parts of our business, and on our shareholders. But in 2003 we made good headway and we’re confident we’ll do that in the years ahead, too. There are two qualities that we think will be crucial to our progress: 1) A coherent company with one focus and one set of values If you’ve been an investor in Pearson for very long (and many of us have), you know what we’ve been doing to change the company: adding and subtracting, planting and pruning until we had businesses that made sense together, that were more productive and innovative because they had things to share. At the same time, we’ve been trying to give those businesses an environment that not only attracts the best people, but also makes their collaboration an everyday event. That work takes a common set of goals and values. Our main aims relate to the larger world of what we do – teaching children to read; helping adults get new skills; providing the best business intelligence; helping citizens and governments function better; helping people acquire knowledge that consists of facts and understanding. As you will have seen before, and as you’ll see elsewhere in this annual report, we value three qualities above all: bravery, imagination and decency. To us, those aren’t just run-of-the-mill words: they guide our decision-making and our behaviour. But do they matter to our prosperity as a company? We believe so. 2) A company that reaches its financial goals We understand very well that our financial goals are the ones that make all the others attainable, and we see more and more evidence of that interplay. Since 2000, the coherence of our set of businesses that share assets and systems and ideas has allowed us to reduce our costs significantly. About a quarter of our senior managers have worked for more than one Pearson business. Last year we sold more than £250m of products and services that were created by the combination of two or more parts of Pearson working together, and that collaboration is growing. To continue to reach our financial goals, we need to get two seemingly simple things right: we need to make our operations more efficient, and we need to make and sell better products and services than our competitors. We’ve been working hard on both areas. More efficient operations Over the past three years we’ve been steadily reducing costs, making better use of our working capital, assessing our investments with more rigour, improving our processes and discipline. In general, we’ve been getting better – leaner and more fit – at running the machinery of our company. |
||||||||||||||||||||||||||||||||||||||||||||||||||||||||||||||||||||
 |
||||||||||||||||||||||||||||||||||||||||||||||||||||||||||||||||||||
| Of course, our most urgent work has been on the fitness of our more cyclical businesses – the ones that have had the most challenges in the unforgiving business climate of the last three years. We’ve reduced costs in our newspapers, in the technology publishing businesses, and in digital learning by more than £200m altogether. All around the company and all around the world, we’ve been taking out layers and trying to use the clout of our size and expertise to best advantage. We’ve combined our international book businesses, for instance, in Canada, Australia and India; and all have seen rising profits. We’ve integrated a lot of our distribution and warehousing; and in the past three years we’ve lowered inventory levels by a third. We’ve created more ways to share assets – design capability, brands, and content – both words and pictures. We’ve multiplied our capacity with technology, such as print on demand, which has allowed us to sell more backlist titles than ever without the expense of holding them in our warehouses. Stronger products and services Being better operators has allowed us to allocate more capital to our brand of research and development, which in turn makes us even stronger. We spend a lot each year investigating, planning and producing new products and services; over the past three years we’ve invested almost £2bn that way. We’re disciplined about that investment, financially and strategically, because gaining more share of the market is crucial to our future. Our aim is to do better than our competitors because what we do is more enticing, better value or just works better. And so far we’re achieving that because we’ve been gaining market share every year for the past three. Here are some highlights: > We’ve grown stronger in school textbook publishing, creating new programmes and increasing our audience in key subjects like reading and social studies. This market will grow rapidly in 2005 – and most of that growth will come in subjects where we’re the market leader. |
||||||||||||||||||||||||||||||||||||||||||||||||||||||||||||||||||||
|
||||||||||||||||||||||||||||||||||||||||||||||||||||||||||||||||||||
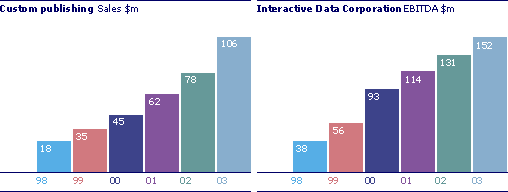
> In college publishing, we’ve grown faster than our competitors for five straight years, even though we’re already the largest. We’ve published more classic, enduring texts than any other publisher, as well as more brand new books. We’ve pioneered the use of technology to enliven the learning process. And we’ve created a model of customised publishing to make bespoke books for individual professors. That business, which had sales of less than $20m in 1998, topped $100m last year |
||||||||||||||||||||||||||||||||||||||||||||||||||||||||||||||||||||
 |
||||||||||||||||||||||||||||||||||||||||||||||||||||||||||||||||||||
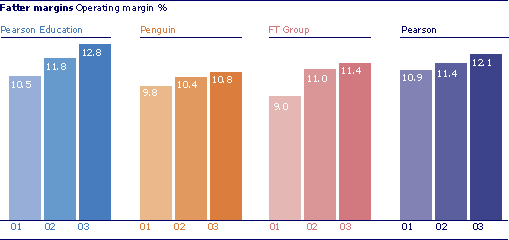
> In six years Interactive Data, our financial information and pricing business, has grown from a $140m to a $440m company. It has grown from the inside out, adding new services to a very enduring customer base, as well as by adding on some new companies. That steady growth enabled the FT Group to increase its profits last year in spite of the fact that advertising revenues continued to wait for a renewal of corporate confidence. |
||||||||||||||||||||||||||||||||||||||||||||||||||||||||||||||||||||
2004 and beyond |
||||||||||||||||||||||||||||||||||||||||||||||||||||||||||||||||||||
| In 2003, our approach to improving our operations and products helped us overcome some situations we didn’t create but had to confront. The business advertising climate remained grim; the weak dollar knocked £181m off our reported sales; and one of our biggest customers, a part of the US government, owes us on a large bill for work we completed in 2002. In spite of those challenges, we made good progress on our financial goals. We improved margins, increased earnings and our return on invested capital rose. This year, we’ll need to call on gravity-defying qualities again to achieve our goal of steady progress on earnings, cash and returns. Business advertising remains erratic (though we may be past the worst); we’ll hit a low point in the five-year school textbook adoption calendar; and the US dollar continues to look weak. Still, we expect to move ahead. And we expect to see underlying financial growth at the same time as we’re investing heavily to prepare for some very good markets we see from next year and beyond. Our confidence stands on three solid pillars: 1. In US school publishing, we can predict a leap in our new business opportunities, which will help increase sales by at least 10% and profits even faster. 2. Our businesses which provide services on long-term contracts for financial institutions and schools and professionals and governments have more than $1bn of new business under contract which mostly begins to flow next year; and they’re adding more all the time. 3. The Pearson businesses that have been most affected by tough economic conditions are leaner than ever, and can rebound strongly when their markets recover. |
||||||||||||||||||||||||||||||||||||||||||||||||||||||||||||||||||||
What is the value of Pearson’s knowledge? |
||||||||||||||||||||||||||||||||||||||||||||||||||||||||||||||||||||
| For Pearson, the value of knowledge is measured by our financial and market progress and by the broader progress of our customers toward satisfying their need for knowledge in this year and beyond. There are times in business when faith is called for. This is not one of them. We have more concrete reasons to believe in our future. By making ourselves better at operating and more innovative at products and services, we’ll make our market-leading positions stronger. That virtuous circle is our goal. In that way, we’ll accomplish not only the kind of financial growth and durability our shareholders should expect, but we’ll also accomplish the goals of our businesses – teaching children to read in a way that makes them readers all their lives; producing great books with great authors and with our own, home-grown talent; having the world’s most informative business news and information sources; providing the services that help schools work better and citizens be more informed. As we meet that basic human yearning for knowledge, we will build the long-term value of our company. |
||||||||||||||||||||||||||||||||||||||||||||||||||||||||||||||||||||
 |
||||||||||||||||||||||||||||||||||||||||||||||||||||||||||||||||||||
Marjorie Scardino, Chief executive |
||||||||||||||||||||||||||||||||||||||||||||||||||||||||||||||||||||
 |
||||||||||||||||||||||||||||||||||||||||||||||||||||||||||||||||||||