Pearson Annual Report 2003
Introduction
    Financial Highlights
    By sector / geography
Chairman's statement
Chief executive's review
About us
Culture and conduct
Operating performance
Governance & financials
Directory of pdfs

Download this page
At Pearson, we feed the mind and fire the imagination.
We have world-leading businesses in education, consumer publishing
and business information. Through our books, newspapers and online services, we educate, entertain and inform millions of people every day. In a world where people depend on knowledge and
brain-power to succeed, we believe we’re in a great business.
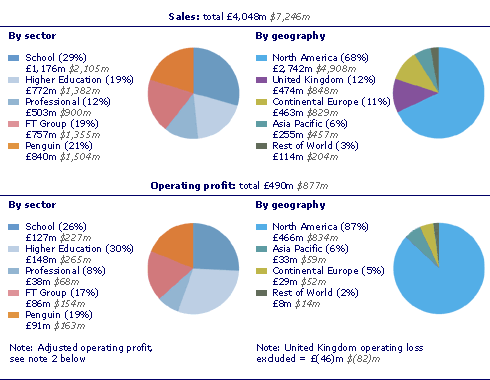
Sales: total £4,048m $7,246m. By sector: School (29%) £1,176m $2,105m Higher Education (19%) £772m $1,382m Professional (12%) £503m $900m FT Group (19%) £757m $1,355m Penguin (21%) £840m $1,504m. By geography: North America (68%) £2,742m $4,908m United Kingdom (12%) £474m $848m Continental Europe (11%) £463m $829m  Asia Pacific (6%) £255m $457m  Rest of World (3%) £114m $204m. Operating profit: total £490m $877m. By sector: Schools (26%) £127m $227m Higher Education (30%) £148m $265m Professional (8%) £38m $68m FT Group (17%) £86m $154m Penguin (19%) £91m $163m. By geography: North America (87%) £466m $834m Asia Pacific (6%) £33m $59m Continental Europe (5%) 29m $52m Rest of World (2%) 8m $14m. Note: United Kingdom operating loss excluded = £(46)m $(82)m. Note: Adjusted operating profit, see note 2 below.
Throughout this report (unless otherwise stated):
1. Growth rates are given on an underlying basis, excluding the impact of currency movements and portfolio changes. In 2003, portfolio changes increased revenues by £89m and profits by £24m, while currency movements reduced revenues by £181m and profits by £27m.
2. Adjusted figures are presented as additional measures of business performance. They are stated before goodwill, integration costs and non-operating items. Goodwill is amortised over no more than 20 years. Business performance measures are non-GAAP measures for UK reporting. Reconciliations of operating profit, adjusted earnings per share and operating free cash flow to the equivalent statutory heading under UK GAAP are included in notes 2, 9 and 27.
3. The value of the dollar has been translated at the year end rate; $1.79: £1 sterling.
   
Site information l Site map l Legal Statement/Disclaimer l Forward looking statements l Contact l Copyright © 2004 Pearson plc